When a plant plans to upgrade conveyor systems every 5 years, it’s not a habit—it’s a hedge against rising maintenance cost, safety exposure, technology obsolescence, and capacity shortfalls. This guide walks through the practical triggers, ROI math, modernization levers, and sector realities that make the ~5‑year review window a smart default. I’ll also share a neutral, real‑world style micro‑example based on typical B2B projects.
Why factories upgrade conveyor systems every 5 years
Five years is long enough for wear, maintenance debt, and obsolescence risks to compound—but short enough to avoid “run‑to‑failure” economics. Consider four forces that converge around the mid‑life point.
Maintenance cost and reliability drift. By year 3–5, belts often exhibit measurable cover loss, repaired splices start to accumulate, and idler bearing failures trend upward. Cleaning systems glaze, skirting hardens or gaps, and carryback grows. Plants recognize the pattern: more interventions per operating hour and more micro‑stoppages. Rather than chase failures piecemeal, teams bundle replacements and retrofits into a planned outage to reset the mean time between failures.
Safety and compliance hardening. While no rule mandates a five‑year cadence, upgrade windows are a practical time to modernize emergency stops, guarding, and safety labeling in line with current best practices. CEMA’s guidance on e‑stops and safeguarding details how older conveyors can be retrofitted to improve stop coverage and lockout/tagout access—see the CEMA Safety Best Practices SBP‑002 (2022). Refreshing warnings and placement is supported by CEMA’s 201 Safety Label Brochure (2022). For dust‑related inspection priorities that touch conveying and handling, review OSHA’s Combustible Dust NEP Directive (2023). In mining, the regulator’s conveyor topic page and recent fatality reports illustrate recurring hazards (guarding, entrapment) and motivate remediation during upgrade projects—see MSHA’s Conveyor Systems safety topic and sample final reports from 2022 and 2024.
Technology refresh cycles. Drives and controls age on a different clock than steel. Around five years, teams reassess whether to add variable‑frequency drives (VFDs), torque control, and condition‑monitoring sensors that weren’t viable or budgeted in the original build. Manufacturers report sizable energy and uptime gains from these retrofits in conveyor and material‑handling contexts—more on that below.
Spare‑parts lifecycle and obsolescence. PLC platforms roll forward, certain VFDs or HMI lines sunset, and idler designs change. A five‑year review checks firmware status, end‑of‑life notices, and supplier continuity, so you don’t discover a critical component is suddenly non‑stocked during a breakdown. Broader procurement guidance since 2021 has pushed industrial teams to treat supply risk proactively—aligning well with a scheduled mid‑life audit to standardize spares and reduce lead‑time exposure; see McKinsey’s 2021 resilience guidance for framing.
Capacity and energy. Throughput targets shift; fines content or moisture change; expansions add transfer points. A five‑year checkpoint lets you re‑size sections, upgrade sealing/cleaning to cut fugitive material, and consider low‑rolling‑resistance elements to lower kWh per ton moved. Think of it like a 60,000‑mile service for your conveying “fleet”—you don’t wait for the engine to seize.
Wear and lifecycle triggers to watch
Condition data—not calendar years—should ultimately call the shots. The table below summarizes what to measure and common review/replace triggers that often surface by the five‑year mark.
| Component | What to measure | Typical review/replace triggers |
|---|---|---|
| Belt (steel‑cord, EP/NN, or sanitary) | Top/bottom cover thickness (mm), splice integrity count, tracking events, carryback levels | Top cover approaching minimum safe thickness for duty, repeated splice repairs in short intervals, persistent mistracking or carryback after housekeeping and cleaner maintenance |
| Idlers (carry/return, impact) | Seized idlers per 1,000, vibration/temperature trends, noise, shell wear/corrosion | Rising seizure rate quarter‑over‑quarter, bearing temperature or vibration outliers, corrosion pitting in marine or corrosive environments |
| Pulleys & lagging | Lagging wear, slippage frequency, coupling/bearing condition | Frequent slip events, glazed lagging reducing cleaner performance, bearing looseness or misalignment |
| Cleaners & skirting | Residual fines, cleaner blade wear, skirt contact uniformity | Excess carryback despite tensioning and blade replacement, skirt gaps causing spillage and dust |
| Drives & controls | Nuisance trips, torque/speed control quality, firmware status | Limited control over throughput (no VFD), obsolete firmware or EOL notices on drives/PLCs/HMIs |
Two field‑proven early‑warning metrics: the count of seized idlers per thousand (tracked monthly) and cover thickness vs. design minimums. When these trend poorly despite routine PMs, a structured upgrade plan tends to beat spot fixes on cost and uptime.
ROI and TCO mini‑calculator you can reuse
Upgrades compete with other capital projects, so we need transparent math. Here’s a simple model you can adapt. It captures energy, downtime, and maintenance‑labor deltas—three drivers that often move enough to justify a mid‑life refresh.
Definitions
- Baseline annual energy cost: E0
- Post‑upgrade annual energy cost: E1
- Annual unplanned downtime hours: D0 baseline, D1 after upgrade
- Downtime cost per hour (lost throughput + labor + penalties): C_d
- Annual maintenance labor/materials on the conveyor: M0 baseline, M1 after upgrade
- One‑time upgrade cost (equipment + install + commissioning): CapEx
Energy savings inputs. Manufacturer literature in material‑handling contexts reports energy reductions with VFDs and optimized drives. Rockwell Automation’s 2020 energy efficiency overview cites 30–40% reductions in some constantly running systems when speed is matched to load (manufacturer data). Danfoss technical briefs (2021) report around 15% savings in a conveyor application with speed optimization and automatic load adjustment (manufacturer data).
Predictive maintenance inputs. Cross‑industry data from Siemens’ Readiness Report (2023) observes paybacks often under 3–6 months for PdM deployments (not conveyor‑specific but directionally helpful). For conveyors, vibration and temperature sensing on idlers and bearings typically reduces unplanned stops and shortens fault‑finding time—benefits you’ll capture in D1 and M1.
Core equations
Annual_Savings = (E0 - E1) + (D0 - D1) * C_d + (M0 - M1)
Payback_Period_Years = CapEx / Annual_Savings
3-Year_Net_Benefit = 3 * Annual_Savings - CapEx
Worked example (illustrative, validate locally)
- E0 = $180,000/year; VFDs + control tuning reduce energy 15% → E1 = $153,000 → Energy delta = $27,000
- D0 = 40 h/year unplanned; sensors + better cleaners drop it to D1 = 22 h/year; C_d = $8,000/h → Downtime delta = (40‑22)*$8,000 = $144,000
- M0 = $120,000/year; streamlined PMs + fewer emergency repairs reduce to M1 = $90,000 → Maintenance delta = $30,000
- CapEx (drives, sensors, sealing/cleaning upgrades, selected component replacements) = $650,000
Plug in:
- Annual_Savings = $27,000 + $144,000 + $30,000 = $201,000
- Payback = $650,000 / $201,000 ≈ 3.23 years
- 3‑Year_Net_Benefit = 3*$201,000 − $650,000 = −$47,000 (negative because payback exceeds 3 years)
Sensitivity. If energy reduction is closer to 25% (validated locally) and downtime drops to 16 h/year, savings rise to $45,000 + $192,000 + $30,000 = $267,000; payback improves to ~2.43 years and 3‑Year_Net_Benefit becomes +$151,000. The exercise: test best‑case, likely, and conservative cases before approval. Here’s the deal: even modest improvements compound when the conveyor is capacity‑constraining.
Technology upgrades that tip the decision
Variable‑frequency drives and torque control. VFDs enable speed‑to‑load matching and soft starts that reduce mechanical stress on belts and gearboxes. Manufacturer literature reports double‑digit energy savings in material‑handling contexts when shifting from fixed‑speed to controlled drives, with the usual caveat to validate on your load profile and duty cycle (see Rockwell and Danfoss above).
Condition monitoring and predictive maintenance. Adding vibration and temperature sensors on idlers, pulleys, and drive bearings supports earlier detection of drag, misalignment, and bearing degradation. Tie them into your CMMS to trigger inspections with evidence rather than calendars. Cross‑industry analysis suggests PdM projects often pay back rapidly (Siemens, 2023); use that to frame your pilot, then scale once your own stop‑time and repair‑hour data back it up. This is also where the secondary keyword—predictive maintenance conveyors—naturally fits your roadmap.
Improved sealing, skirting, and cleaning. Upgraded primary/secondary cleaners, wear‑resistant blades, and modern skirt systems reduce carryback and spillage—cutting cleanup hours and dust. These aren’t glamorous line items, but they prevent a surprising share of micro‑stoppages and safety housekeeping citations.
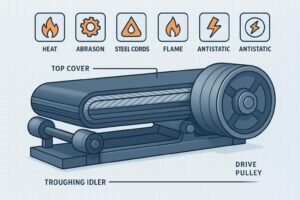
Fire‑resistant and heat‑resistant belts. In hot or fire‑risk environments (e.g., coal, coke, clinker), modern compounds and cover formulations improve resistance and extend service life under the same duty, while also aligning with present‑day safety expectations and cleaning performance.
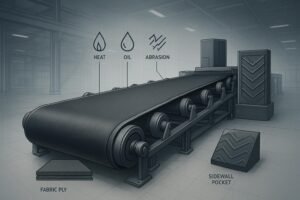
Sanitary and quick‑clean designs. In food and agri, modular or hygienic belts and simpler clean‑in‑place fixtures reduce sanitation time and residual soil. For instance, independent testing reported by Habasit for its Super HyCLEAN modular designs shows at least 50% reduction in sanitation time/resources and 2.2–4.1× lower residual soil after repeated rinses (manufacturer data)—see Habasit’s Super HyCLEAN testing summary and industry brochure highlights.
Sector snapshots and a practical micro‑example
Mining and quarrying. Abrasion, impact, and dust load punish covers and idlers; fire‑resistant belts, improved sealing/cleaning, and VFDs on long overlands or major trunk lines are common mid‑life upgrades. Safety programs often piggyback on these windows to expand e‑stop coverage and refresh guards and labeling consistent with current best practices.
Ports and logistics terminals. Salt air, rain, and fine materials combine to corrode idlers and degrade lagging and structure. Mid‑life retrofits often swap in corrosion‑resistant idlers or shells, ceramic‑lagged pulleys, and improved enclosures/sealing to control spillage in wind. Controls refreshes may also consolidate legacy drives and standardize spares across multiple berths or yards.
Cement and steel. Heat, abrasive fines, and impact at loading points accelerate cover wear and idler bearing failures. Plants use the five‑year window to harden transfer points (impact idlers, chute liners), adopt more abrasion‑resistant compounds, and re‑lag pulleys. Where kilns or mills dictate pace, any energy reduction from drive control assists peak‑load management.
Food and agriculture. Hygienic design and quick changeovers trump raw abrasion. Swapping to sanitary belting and easier‑to‑clean components can recapture sanitation hours and lower contamination risk. When cleaning windows rule the schedule, even modest reductions translate to real throughput.
A neutral B2B micro‑example (manufacturer data where indicated). A bulk‑materials operator sought to stabilize a 180‑m inclined conveyor that had accumulated three hot‑splice repairs in 18 months and was experiencing rising carryback. The review at year five identified: top cover near the site’s minimum thickness, glaze on the primary cleaner, worn skirting with gaps, and no speed control on a constant‑speed drive. The team proposed a bundled outage: replace belt with a profile suited for incline, refresh cleaners and skirting, and fit a VFD to the head drive with torque control. On similar projects performed by established conveyor manufacturers such as BisonConvey (product ranges include steel‑cord, EP/NN, chevron and sidewall belts; idlers; pulleys), the practical outcomes reported by manufacturers tend to follow a pattern: steadier tracking, fewer emergency splice repairs, measurable reductions in carryback after cleaner/skirt upgrades, and energy savings consistent with drive control improvements (manufacturer data, site‑specific). The point isn’t that any single brand guarantees an outcome; it’s that aligning component choice with the actual duty—then bundling mechanical and control upgrades—often flips the repair‑spiral into a stable operating baseline. Validate assumptions with your own measurements and a short post‑upgrade monitoring plan.
Your upgrade decision framework
Start with data you already track—downtime minutes, maintenance hours, energy bills, and inspection findings—and let that steer scope and timing. A practical path many plants follow looks like this: first, score safety gaps and compliance exposures (guarding condition, e‑stop coverage, label currency) against current best practices; second, map condition trends (cover thickness, splice integrity, seized‑idler rate, lagging wear) and flag components trending to minimums or accelerating; third, evaluate technology levers (VFDs, sensors, cleaning/sealing) that your baseline omitted; fourth, check spares lifecycle (firmware status, EOL notices, supplier continuity) to avoid surprises. If two or more areas show medium‑to‑high risk or opportunity, coordinate a bundled mid‑life project rather than piecemeal fixes.
One‑day assessment checklist you can run this week:
- Walk the belt run with a thickness gauge and record top cover at multiple stations; log splice count/condition and any patch repairs.
- Sample 1,000 idlers: count seized or noisy units; note hot spots with a handheld IR gun; record any shell corrosion or buildup.
- Inspect pulleys for lagging wear/glaze and check drive/bearing alignment; note any slippage events in the shift log.
- Review cleaner blade wear and tension; inspect skirting for uniform contact and evidence of fines escaping; note housekeeping time spent.
- Pull a drives/controls inventory: firmware versions, nuisance trips, torque/speed control options, and any OEM end‑of‑life notices.
- Compile the last 12 months: downtime hours attributed to the conveyor, maintenance hours and emergency work orders, and energy use for the circuit; calculate cost per downtime hour.
- Screen upgrade levers with ROI math: energy reduction case, plausible downtime reduction, and maintenance savings; generate best/likely/conservative payback.
Sources and further reading
- Safety practices for e‑stops and retrofits: CEMA Safety Best Practices SBP‑002 (2022).
- Safety labeling updates and placement: CEMA Safety Label Brochure 201 (2022).
- Dust‑related inspection priorities touching conveying/handling: OSHA’s Combustible Dust NEP Directive (2023).
- Mining sector conveyor safety lens and incident patterns: MSHA Conveyor Systems safety topic; sample final reports 2022 and 2024.
- Energy/drive control context in material handling (manufacturer data): Rockwell Automation energy efficiency overview (2020); Danfoss technical brief (2021).
- PdM payback framing across industries: Siemens Readiness Report (2023).
- Hygiene and sanitation performance deltas (manufacturer data): Habasit Super HyCLEAN testing summary and industry brochure.
Note: Validate assumptions with on‑site measurements and your own runsheets before final budget commitments.
Next steps
If you’re planning to upgrade conveyor systems every 5 years, sanity‑check it with your data: run the one‑day assessment, pressure‑test the ROI model, then bundle scope for a single, well‑planned outage.