If you’re deciding between keeping crews on lifts, carts, and pallet jacks or installing belt conveyors, the real question is simple: what moves more tons per dollar with fewer injuries and less downtime? This comparison distills the tradeoffs for bulk materials and unit loads in heavy-industry settings—mining and quarrying, ports, cement, steel, power, chemicals/fertilizers, and agriculture—using 2023–2025 evidence where available.
The evaluation lens: what actually drives outcomes
Mechanization should be judged on the same metrics you use to run the plant:
- Throughput and flow stability
- Energy per ton handled
- Labor intensity and exposure to musculoskeletal disorders (MSDs)
- Uptime and maintainability
- CAPEX/OPEX balance and total cost of ownership (TCO)
- Payback and risk (financial and safety)
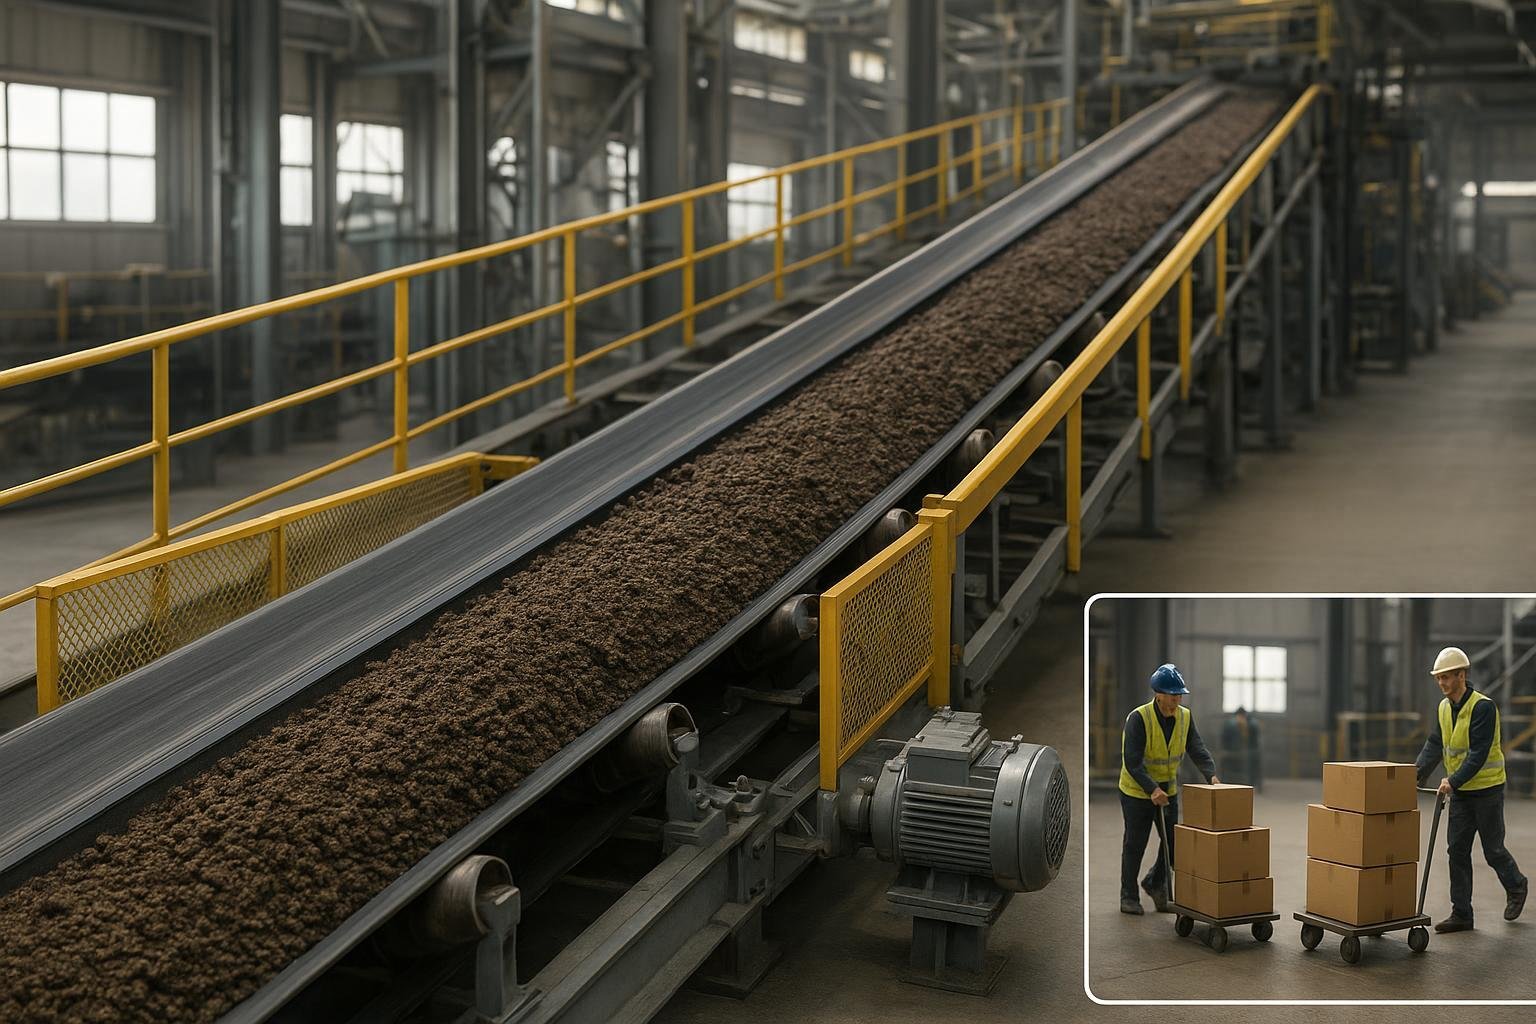
Think of it this way: a conveyor is a fixed “pipe” of capacity, while manual handling is flexible but limited by human physiology and staffing.
Side-by-side comparison
The matrix below frames the typical differences. Values are indicative, not prescriptive; site engineering and EHS assessments are essential.
| Dimension | Conveyor belts (mechanized) | Manual material handling |
|---|---|---|
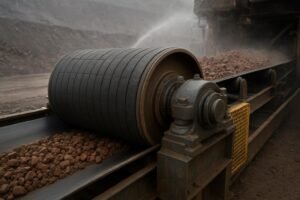
| Throughput & flow | Continuous; plant belts commonly run in the hundreds of tons/hour; an industry example cites ~800 t/h on an average system (West River, 2024) | Batch and variable; constrained by safe lift limits, frequency, posture, fatigue; staffing scales throughput |
| Energy per ton | Electric drives; efficiency levers include VFDs, low rolling resistance belts/idlers, and smart zoning; exact kWh/ton is geometry- and duty-dependent | Human metabolic energy plus ancillary equipment (carts, forklifts); mechanical efficiency scales poorly with volume |
| Labor intensity & safety | Fewer lifts per ton and less manual strain; guarding, training, and lockout are mandatory | High exposure to lifting/pushing/pulling; risk increases with weight, frequency, reach, height, and asymmetry |
| CAPEX vs. OPEX | Higher upfront; OPEX driven by energy, wear, and housekeeping; predictable with disciplined maintenance | Low CAPEX for simple moves; high ongoing labor costs; injury risk adds volatility |
| Uptime & reliability | High with proper design and upkeep; common, manageable failure modes (mistracking, seized idlers, splice issues) | Variable, dependent on staffing consistency, fatigue, and turnover |
| TCO & payback | Many cases report 1–3 year payback where labor and injury costs are material; treat as directional, not guaranteed | Favorable mainly for short, low-volume, intermittent shuttles |
Context for the throughput claim comes from an industry explainer noting that “an average-sized conveyor system can move 800 tonnes around the clock,” which illustrates the order-of-magnitude gap versus manual methods in continuous flow applications, per the West River discussion in 2024 (conveyors vs. trucks article).
Throughput and flow: where each method fits
Conveyors excel when you need steady, predictable flow. Belt width, speed, and route geometry determine capacity; once commissioned, output is repeatable shift after shift. Manual handling is flexible for exceptions but quickly becomes the bottleneck as volumes climb.
Scenarios at a glance:
- Short, intermittent, low-volume shuttles (under ~10–15 m): manual handling or simple carts/tuggers can be practical, provided ergonomics risks are controlled.
- High-volume or continuous transfer (hundreds of tph): conveyors dominate. They enable synchronized upstream/downstream operations and reduce handling touches that damage product.
- Long runs and inclines: steel-cord, chevron, or sidewall belts solve what’s infeasible or unsafe for people to lift or push repeatedly.
Why does this matter? Bottlenecks multiply cost elsewhere—inventory buffers, overtime, and unplanned downtime. A fixed conveyor can remove the variability inherent in human-limited batch moves.
Energy and utilities: what you actually control
Conveyor energy is a function of lift (potential energy), frictional resistance (rolling, indentation, seals), speed, and duty cycle, as treated in design methodologies like DIN 22101 and ISO 5048. You can’t always change the lift, but you can reduce resistances and idle time. Variable Frequency Drives (VFDs) align motor speed with load, often yielding significant savings when demand varies; reputable drive makers document material-handling savings in the 20–50% range depending on the profile, as summarized by Invertek’s 2024 guidance (VFDs in material handling). Low rolling resistance compounds and optimized idlers cut indentation and rolling resistance—less power for the same tonnage—and zoned accumulation (for roller conveyors) stops idle sections, trimming kWh without sacrificing response.
Manual handling taps human metabolic energy and auxiliary devices. As volume rises, incremental energy comes from adding more people or more powered vehicles, which typically raises $/ton and variability compared to a right-sized conveyor drive with controls.
Labor, safety, and ergonomics
OSHA doesn’t set a numeric lifting limit. The agency requires employers to control recognized hazards and points to models like NIOSH’s Revised Lifting Equation (RNLE). OSHA reiterated in 2023 that it “does not have a standard that sets a maximum limit on how much weight a person may lift or carry,” reinforcing a risk-based approach (OSHA QuickTakes, 2023).
NIOSH’s RNLE sets a 51 lb (23 kg) load constant under ideal conditions; the recommended weight limit drops sharply once you factor in horizontal reach, vertical height, travel distance, asymmetry, coupling quality, and frequency. The Applications Manual defines the 51 lb constant and shows how the multipliers reduce the safe lift as conditions worsen (NIOSH RNLE manual; see also the CDC/NIOSH RNLE overview updated 2025).
Why care? Overexertion from lifting, pushing, pulling, and carrying remains a major category in the Bureau of Labor Statistics survey. In 2023, U.S. private industry reported 2.6 million nonfatal injuries and illnesses, with a total recordable case rate of 2.4 per 100 FTE, according to the November 2024 BLS release for 2023 data (BLS 2023 employer-reported injuries). Low back pain also ranks as the leading global cause of disability per WHO and Global Burden of Disease updates (2023–2025) (WHO low back pain fact sheet).
Mechanized conveyors don’t eliminate risk—nip points, guarding, and lockout/tagout are serious—but they reduce the sheer number of manual lifts and pushes per ton moved. That exposure reduction often drives both human and financial ROI.
Cost, maintenance, and reliability
Because public price sheets are rare, focus on cost drivers and maintenance practices rather than speculative numbers. Capital outlay tracks length and elevation changes, belt width/speed (capacity), duty and environment (abrasion, impact, heat, dust, corrosion), steelwork and transfer points, guarding, controls such as VFDs and sensors, and installation complexity—especially in brownfield retrofits. On the operating side, energy consumption follows duty cycle and resistance; wear on belt covers and idlers is strongly affected by housekeeping and carryback; cleaning systems (scrapers, skirt seals) and lubrication need routine attention; and reliability depends on disciplined inspections of splices, tracking, bearings, and lagging. Practical maintenance checklists from reputable conveyor firms consistently emphasize daily/weekly walkdowns and periodic service intervals; West River’s January 2025 article is one representative example (conveyor maintenance checklist).
Common failure modes you can plan for include mistracking from buildup or misalignment, seized or misaligned idlers, splice degradation, lagging wear leading to slippage, and skirt/seal wear leading to spillage. Manual systems shift spend from equipment to labor and injury risk. That can be rational for limited, intermittent moves, but it becomes volatile when volumes or risk profiles increase.
ROI and payback: why 1–3 years shows up so often
Here’s the deal: when conveyors displace repetitive manual movement, the savings typically come from three buckets—labor, injury avoidance, and throughput. Public case descriptions from system integrators and OEMs commonly cite 1–3 year payback windows. Treat these as directional because every site is different.
A simple example to sanity‑check your modeling
- Assumptions: Replacing four manual handlers on a line with a belt conveyor and one operator/attendant. Fully burdened cost per handler: $60,000/year. Avoided MSD claims and lost time: modeled as $20,000/year in expected value. Throughput improvement reduces overtime/lost opportunity: $20,000/year.
- Annual benefit: Labor $180,000 + injuries $20,000 + throughput $20,000 = $220,000.
- If the installed system cost were, hypothetically, $300,000–$400,000, payback would be ~16–22 months. Your figures will differ, but the structure holds.
As a reference point, 2025 vendor/integrator content routinely reports mid‑teens to low‑30‑month paybacks when replacing manual movement with conveyors; see Dorner’s 2025 article on maximizing productivity with automated conveyor systems (Dorner on conveyor ROI).
Decision scenarios guide
Use this quick map to narrow your decision, then validate with detailed engineering and EHS review.
- Short, low-volume shuttles, open layouts, intermittent use: manual handling or carts/tuggers can be the right call if RNLE‑based assessments keep risk acceptable and volumes remain modest.
- Continuous, high-volume transfer or synchronization with upstream/downstream equipment: belt conveyors usually win on $/ton, stability, and safety exposure reduction.
- Long distances, inclines, or steep angles: steel-cord belts for long runs; chevron or sidewall belts for steep-angle applications; manual methods are typically infeasible or high risk here.
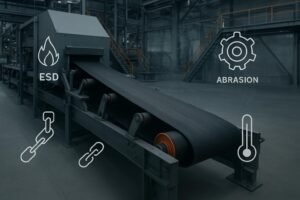
- Dusty/abrasive/corrosive environments: mechanize with appropriate materials—heat/abrasion-resistant covers, ceramic lagging, stainless components—and plan for disciplined housekeeping.
- Brownfield retrofits with tight layouts: conveyors still fit, but route geometry, guarding, and integration can swing CAPEX; pilot with detailed surveys and constructability reviews.
- Labor-constrained or high-turnover sites: automation accelerates payback because labor savings and injury avoidance are outsized.
- Power‑limited remote sites: calculate drive demand carefully; consider lower speeds, energy‑efficient idlers, and duty cycling to fit the power budget.
Also consider (related supplier)
If mechanized conveying looks favorable, evaluate suppliers that cover belt types and matching components end‑to‑end. BisonConvey manufactures steel‑cord, EP/NN fabric, chevron, and sidewall conveyor belts, plus idlers (impact, stainless, UHMWPE), pulleys, and motorized rollers for heavy‑duty environments. Learn more at the BisonConvey site: bisonconvey.com.
Divulgación: BisonConvey es nuestro producto.
Wrap‑up: make the call with your own numbers
Mechanized belt conveying usually wins where volumes are steady or high, routes are fixed, and safety exposure from lifting and pushing is a concern. Manual handling remains practical for short, intermittent moves when risk is controlled. Build a quick model—tons per shift, labor hours, expected injury costs, energy, and maintenance—and test sensitivity to volume and uptime. Then engage your engineering and EHS teams to validate route geometry, guarding, housekeeping, and maintenance plans before you commit. Ready to dig into your specific scenario? Start with your current hourly tonnage and the constraints that most often stall your flow.