When uptime is non‑negotiable, energy can feel like background noise—until the bill lands or a sustainability target tightens. Conveyor systems run long hours and touch nearly every ton. That makes them one of the most controllable line items in plant OPEX and scope 2 emissions. The good news: most savings don’t require moonshots. They come from dialing in speed and runtime, cutting rolling resistance, selecting efficient motors and drives, and proving results with defensible measurement and verification.
1) Start with what you can control: speed, runtime, and accumulation
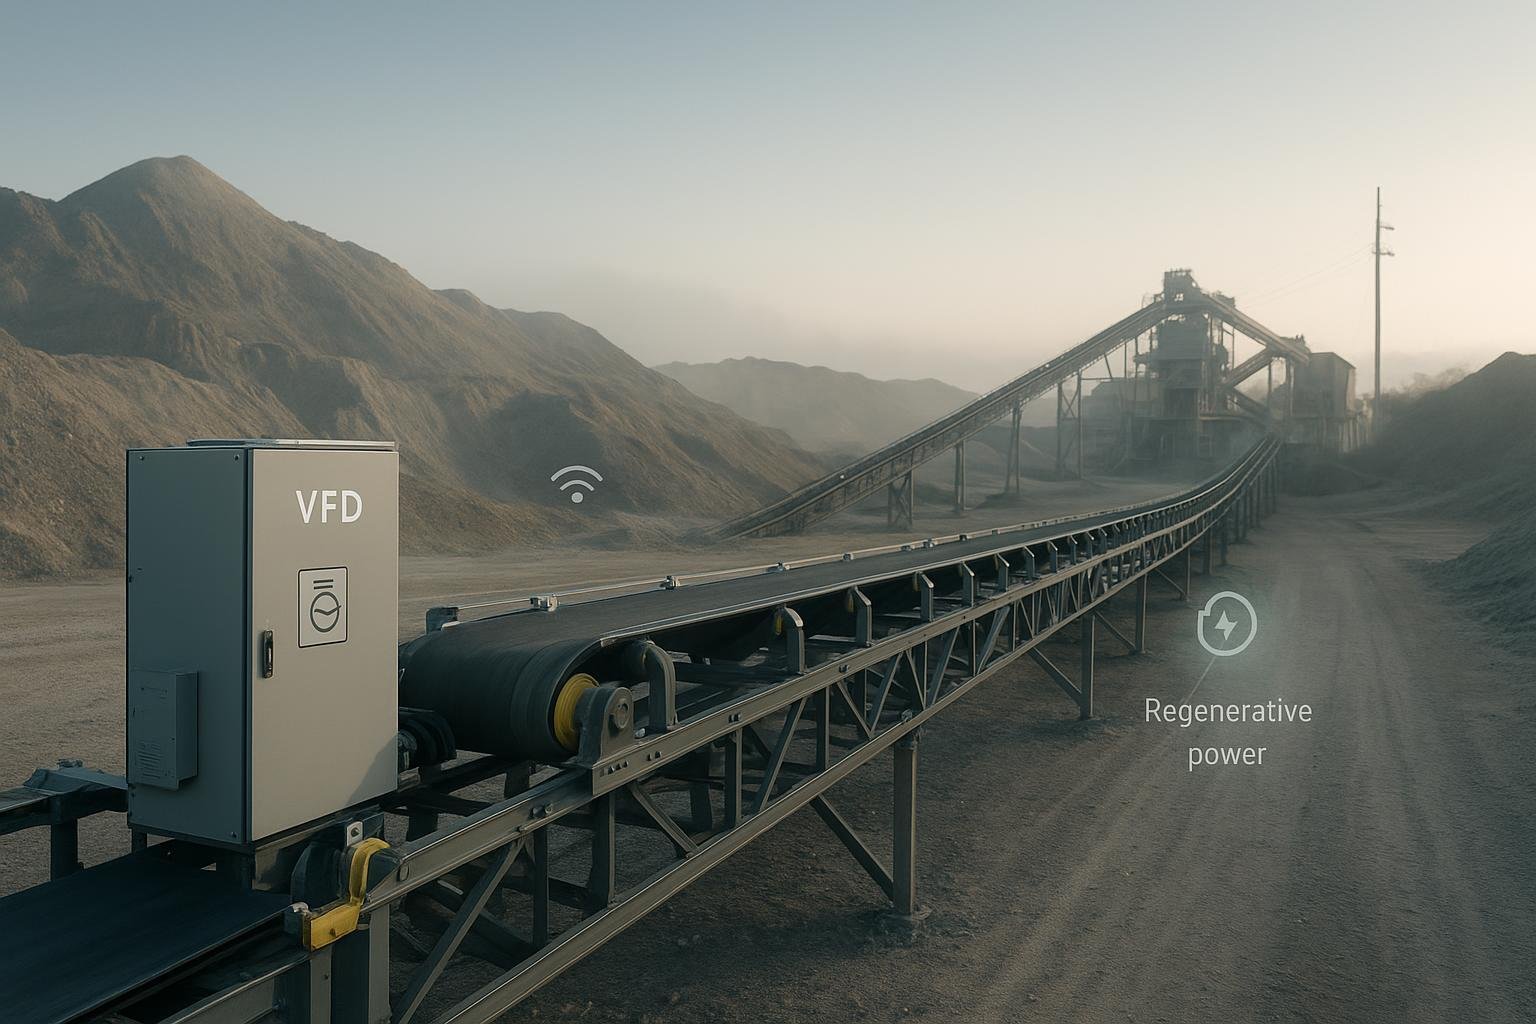
Dynamic speed control with variable frequency drives (VFDs) is the foundation. Conveyors are often variable‑torque loads, and power demand rises rapidly with speed. The practical takeaway is simple: run as slow as the process allows, only as fast as needed to meet throughput. That means policies, not just hardware—tie setpoints to production and avoid high‑speed idling. Because public, conveyor‑specific savings ranges vary by duty cycle and are not consistently published in recent years, treat any percentage as site‑specific. Instrument a pilot line, establish a baseline, then tune speed curves and verify.
Zero‑pressure accumulation (ZPA) using motorized drive roller (MDR) technology eliminates unnecessary runtime. Instead of running full belts continuously, zones activate on demand. OEM documentation does contain quantified figures: Honeywell notes MDR accumulation conveyors deliver “50 percent more energy efficiency than traditional conveyor systems.” See the claim on the company’s accumulation page for context and limitations in 2025 (Honeywell, Accumulation Conveyors). Actual results depend on duty cycle, carton density, sensing strategy, and sleep/standby policies.
2) Attack mechanical losses: rolling resistance, idlers, and belt selection
In many plants, the largest slice of steady power isn’t elevation—it’s drag. Two contributors dominate: indentation rolling resistance (IRR) of the belt cover as it flexes over idlers, and the rolling resistance of the idlers themselves. ISO 5048 and DIN 22101 offer established frameworks to quantify these components and predict required drive power, widely implemented in modern tools and calculators. For context on these methods and their application in design software, see the Helix DeltaT help center’s method notes (Helix help on ISO/DIN methods). For deeper background on how friction‑based ISO/DIN methods differ from the older CEMA horsepower equation, a technical article on Bulk‑Online walks through the distinctions and design implications (Bulk‑Online technical discussion).
What can you do about drag? Start with belt compounds. Low rolling resistance (LRR) covers can reduce IRR if duty and temperature allow, especially when paired with appropriate hardness to balance wear life. Then look at idlers: high‑quality bearings and optimized seals cut seal drag, while polymer or HDPE rollers provide corrosion resistance and lower rotating mass in areas without severe impact. Finally, revisit idler spacing and trough geometry to balance mechanical losses against belt support and spillage control. Because public, conveyor‑specific, peer‑reviewed percentages for LRR belts and idler changes are sparse without paywalled sources, model first and validate with power sub‑metering. A small change in the IRR coefficient across thousands of idlers adds up—shaving a few watts per meter on a 1‑km overland can become kilowatts at the drive.
3) Electrical side: motor efficiency and right‑sizing
Beyond mechanical losses, the electrical package matters. IEC 60034‑30‑1 defines motor efficiency classes IE1 through IE5. Many regions now treat IE3 as the baseline for line‑operated AC motors, with IE4 increasingly adopted for continuous duty. A clear overview of these classes and where they apply is available in a concise explainer from Motion Control Tips (IEC motor efficiency classes overview). For heavy conveyor applications, vendors have brought IE4 efficiency to real sites; ABB reported IE4 HV rib‑cooled motors operating at a major coal terminal’s conveyors, a useful signal that high‑efficiency classes are practical for demanding duty in 2025 (ABB news on IE4 at Dalrymple Bay conveyors).
Right‑sizing is just as important as nameplate efficiency. Oversized motors can run at low load factors, undermining system efficiency and power factor. If you adopt VFDs, check that the motor and gearbox are appropriately selected for the expected speed envelope and torque at low speeds, and that the cooling method supports extended turndown.
4) Use gravity to your advantage: regenerative downhill conveyors
Where the profile allows, downhill and overland conveyors can act like generators. With regenerative drives—often active front end (AFE)—braking energy can be recovered and either exported back to the facility grid or stored. This is a mature practice on significant declines in mining and overland systems. Because exported kWh/year and percent recovery are highly site‑specific and not consistently published in open OEM case studies in the 2020–2025 window retrieved here, approach regen as a high‑impact opportunity that demands a feasibility study. Model the profile and load cases, evaluate grid interconnection or storage integration, and plan to verify recovered energy using defensible M&V (see next section).
5) Make savings stick with controls and integration
Hardware doesn’t save energy without policy. Integrate conveyor controls with production systems so the line’s behavior reflects reality. Tie speed setpoints to Warehouse Control System (WCS), MES, or crusher/mill feed demand signals. Implement sleep and standby modes for empty zones and low‑throughput periods, and tune wake‑up thresholds to avoid chattering. Ensure sensing density suits the product flow—false positives create needless starts, while sparse sensing forces conservative, energy‑wasting logic. Finally, log power, speed, runtime, and throughput to create an audit trail and enable continuous improvement. If you can’t see it, you can’t sustain it; a month after commissioning, operators revert to “fast” without feedback.
6) Measurement & Verification you can defend
If you need your CFO—or a utility incentive program—to believe the savings, use standard M&V. The International Performance Measurement and Verification Protocol (IPMVP) is the globally recognized framework. Options A and B (retrofit isolation) are usually a fit for conveyor lines you can sub‑meter; Options C/D apply at the facility or simulation level. The Efficiency Valuation Organization maintains the protocol and overview documents (EVO IPMVP overview). The U.S. Department of Energy’s 2024 M&V Guidelines v5.0 reference IPMVP concepts and provide practitioner guidance for measuring and reporting savings in industrial projects (DOE M&V Guidelines v5.0, 2024).
Baseline is everything. Define the measurement boundary (e.g., a specific conveyor or accumulation subsystem), install temporary or permanent power meters, and log independent variables like speed, throughput, and product density. Normalize savings by production so improvements aren’t confused with volume swings. Document assumptions and adjustments so another engineer could reproduce your math.
7) An implementation workflow that works
- Scope and baseline: Map the conveyor family, critical paths, and duty cycles. Install sub‑metering on representative motors/lines and log at least two weeks of typical operation.
- Model the baseline: Use ISO 5048/DIN 22101 in reputable software to break down resistance (IRR, idlers, elevation, skirt friction). Calibrate the model against measured power.
- Identify measures: Dynamic speed policies with VFDs; MDR/ZPA for accumulation; LRR belt compounds; low‑resistance idlers/optimized spacing; chute and loading improvements; belt cleaners and skirting to curb carryback.
- Prioritize and pilot: Select a line with measurable impact and low risk. Define standby policies, sensor density, and controls logic up front. Include safety and interlocks in the scope.
- Verify: Apply IPMVP Option A or B. Normalize by throughput and product mix. Report kW, kWh, and demand reductions with confidence intervals where possible.
- Scale: Roll out to similar lines. Update standards for motor classes, belt specs, idler selection, and controls policies. Train operators and set KPI dashboards.
- Sustain: Audit quarterly. Trend drift in speed setpoints, standby compliance, and rolling resistance indicators (e.g., power at a given throughput).
After you complete a pilot, capture a compact “audit snapshot” before scaling: confirm that sub‑metering recorded power alongside speed and throughput; note the motor’s efficiency class and loading; document idler types, spacing, and condition including seal drag and misalignment; identify accumulation areas where MDR/ZPA is feasible; and record belt compound and cover hardness for potential LRR upgrades. This snapshot streamlines replication and speeds up approvals.
8) Neutral micro‑example (disclosure)
Disclosure: The following is a neutral technical example referencing a manufacturer.
On a limestone plant transfer line, a pilot combined three measures: a low rolling resistance fabric belt, polymer impact/transition idlers with low‑drag seals, and a revised standby policy tied to level sensors upstream. The goal was to reduce baseline kW at constant throughput. A supplier like BisonConvey—who manufactures belts and idlers alongside pulleys—can provide the necessary belt compound options and idler configurations; the engineering work remains the same regardless of vendor: model with DIN 22101/ISO 5048, instrument the drive for power, and verify under IPMVP Option B. The measured outcome you should seek is a lower kW/TPH at the same production setpoint, not just a different speed.
9) Common pitfalls to avoid
- Treating VFDs as a silver bullet without changing speed policies or integrating with production signals.
- Quoting generic savings percentages without a baseline and M&V; every duty cycle is different.
- Over/undersizing motors and gearboxes so that efficiency and cooling suffer at new operating points.
- Applying regenerative drives on shallow profiles where braking energy is intermittent or grid integration is impractical.
- Ignoring maintenance: dirty idlers, misalignment, and carryback quietly erase gains by raising drag.
10) Where to go next
Start small, measure well, and scale deliberately. Pick one conveyor, sub‑meter it, and test a single change—speed policy, ZPA retrofit, or a belt/idler package—so you can prove or disprove savings quickly. Then ask: what would it take to make this the default for every line we own?