Leaders in mining and quarrying are planning 2026 budgets amid easing input costs, selective investment pipelines, and a renewed focus on reliability. This briefing distills global CAPEX/OPEX movements from 2019–2025 and connects them to on-the-ground conveying decisions that affect uptime, safety, and total cost of ownership.
How we selected metrics (and what they mean for you)
We prioritized recent, authoritative sources and metrics with direct operational relevance for mines and quarries: PwC’s Top 40 miner analysis for profitability and capital discipline, macro cost outlooks from the World Bank and IMF, regional CAPEX signals from Natural Resources Canada (Canada), the Australian Bureau of Statistics (Australia), and Cochilco (Chile), freight/logistics cost indices from Drewry, OEM signals from Caterpillar on autonomy, and engineering guidance from Martin Engineering and ABB on conveyor OPEX levers. Where paywalled series limited precision, we report directional movements and cite the canonical landing pages. Each item below includes a 2025 spotlight, 2019–2025 movement, notable regional variance, and a practical conveying implication.
1) Profitability and capital discipline
-
2025 spotlight: Top 40 miners’ EBITDA margins compressed in 2024 (around 22% vs. 24% in 2023), reflecting persistent operating cost pressure; gold producers helped offset softness elsewhere. According to PwC’s global Mine 2025 overview, discipline remains in capital programs with emphasis on value over volume. See PwC’s Mine 2025 overview and highlights.
-
2019–2025 movement: Recovery post-2019, sharp cost spikes in 2022–2023, gradual normalization into 2025 but margins remain below recent peaks.
-
Regional variance: Americas and APAC feature prominently in large-cap portfolios; non-gold segments saw greater margin compression.
-
Operational implication (conveying): Cost discipline elevates OPEX reliability levers—belt life, idler sealing, lagging traction, and cleaner effectiveness—to protect throughput without heavy CAPEX.
2) Macro cost drivers: commodities easing and inflation disinflating
-
2025 spotlight: The World Bank expects overall commodity prices to fall about 5% in 2025, with metals down roughly 10% year-over-year, while energy prices continue to soften from 2022 highs. Global headline inflation is projected near 4.2% in 2025, per the IMF’s latest update, supporting OPEX stabilization. See the World Bank’s Commodity Markets Outlook (April 2025) and the IMF’s World Economic Outlook Update (January 2025).
-
2019–2025 movement: 2020 dip, 2021–2022 surge in energy/metals, 2023–2025 normalization—often above 2019 baselines but below the peaks.
-
Regional variance: Importers benefit more from easing energy; producer economies in LATAM/Africa experience mixed terms-of-trade effects.
-
Operational implication (conveying): Even with softer inputs, volatility remains. Energy-efficient conveying (e.g., variable-speed drives, precise idler alignment, well-maintained cleaners) hedges swings and lowers cost per tonne. ABB’s overview highlights efficiency levers in Conveyors: systems and drives.
3) North America proxy: Canada minerals CAPEX intentions
-
2025 spotlight: Canadian minerals mining CAPEX intentions are CA$9.8B for 2025, down from CA$10.3B (prelim.) in 2024, with non-metals such as potash expected to rise to CA$6.7B. See NRCan’s Capital Expenditures (minerals sector) series.
-
2019–2025 movement: Rebound after the 2020 downturn, peak around 2023 (~CA$12.0B), then softening into 2024–2025.
-
Regional variance: Saskatchewan’s potash expansions offset declines elsewhere in metals.
-
Operational implication (conveying): With flatter CAPEX, operations prioritize OPEX optimization—standardizing components, reducing carryback/spillage, and tightening maintenance intervals to sustain throughput.
4) Australia mining private new capex outlook
-
2025–26 spotlight: ABS Estimate 4 places mining private new capex at AU$54.7B (+3.3% versus Estimate 3), signaling cautious growth. See ABS Private New Capital Expenditure and Expected Expenditure (latest release).
-
2019–2025 movement: Cyclical capex tied to iron ore and lithium, with energy-transition metals sustaining project visibility.
-
Regional variance: Western Australia dominates on iron ore; lithium regions contribute volatility and shorter approval cycles.
-
Operational implication (conveying): Selective new-builds continue, but brownfield debottlenecking and reliability upgrades are likely to carry budget priority.
5) Chile’s expanded investment pipeline
-
2025 spotlight: Cochilco reports a US$104.549B mining investment portfolio for 2025–2034, up from US$83.181B for 2024–2033—the largest in a decade. See Cochilco’s investment portfolio portal.
-
2019–2025 movement: Portfolio growth tracks copper/lithium priorities within tighter environmental and social permitting frameworks.
-
Regional variance: Chile’s pipeline strength contrasts with mixed signals in North America and Europe, where permitting and costs have slowed some projects.
-
Operational implication (conveying): More expansions mean sustained demand for high-reliability conveying—dust control, spillage management, and predictable maintenance schedules will be integral to ESG commitments.
6) Freight and logistics cost environment
-
2025 spotlight: Drewry’s World Container Index composite was around $2,213/FEU as of December 25, 2025, reflecting normalization from pandemic-era peaks yet ongoing volatility from geopolitical routing changes. See Drewry’s World Container Index.
-
2019–2025 movement: Rates soared in 2021, corrected in 2023–2025 with episodic disruptions (e.g., Red Sea rerouting, congestion, capacity management).
-
Regional variance: Asia–US and Asia–EU lanes exhibit the most sensitivity to geopolitical shifts.
-
Operational implication (conveying): Inventory buffers and component standardization help insulate maintenance schedules from shipping volatility.
7) Technology and automation CAPEX signals reach aggregates
-
2025 spotlight: Caterpillar’s autonomous Cat 777 debuted at Luck Stone in late 2024, extending autonomy from large mines into aggregates. Cat reports its global autonomous fleet has moved 8.62B+ tonnes and traveled 325M+ km. See Caterpillar’s autonomy milestone announcement.
-
2019–2025 movement: Adoption built steadily in iron ore and copper since the late 2010s; 2024–2025 broadens use cases and reduces the threshold for autonomy projects.
-
Regional variance: Strongest uptake in Australia and North America; regulatory and labor dynamics shape pace elsewhere.
-
Operational implication (conveying): Autonomy relies on predictable plant performance—minimize unplanned stops on conveyors with better belt support, sealed idlers, reliable lagging, and consistent cleaner upkeep.
8) Conveyor OPEX drivers: carryback, spillage, and energy efficiency
-
2025 spotlight: Engineering guidance reiterates that poor belt support, misaligned idlers, and inadequate cleaners raise maintenance burden, downtime, dust/housekeeping risks, and potential regulatory citations. See Martin Engineering’s Foundations resources on transfer chutes and dust/spillage control and ABB’s conveyors efficiency overview.
-
2019–2025 movement: Wider adoption of IPCC systems, gearless and variable-speed drives, and condition monitoring on bearings and rollers.
-
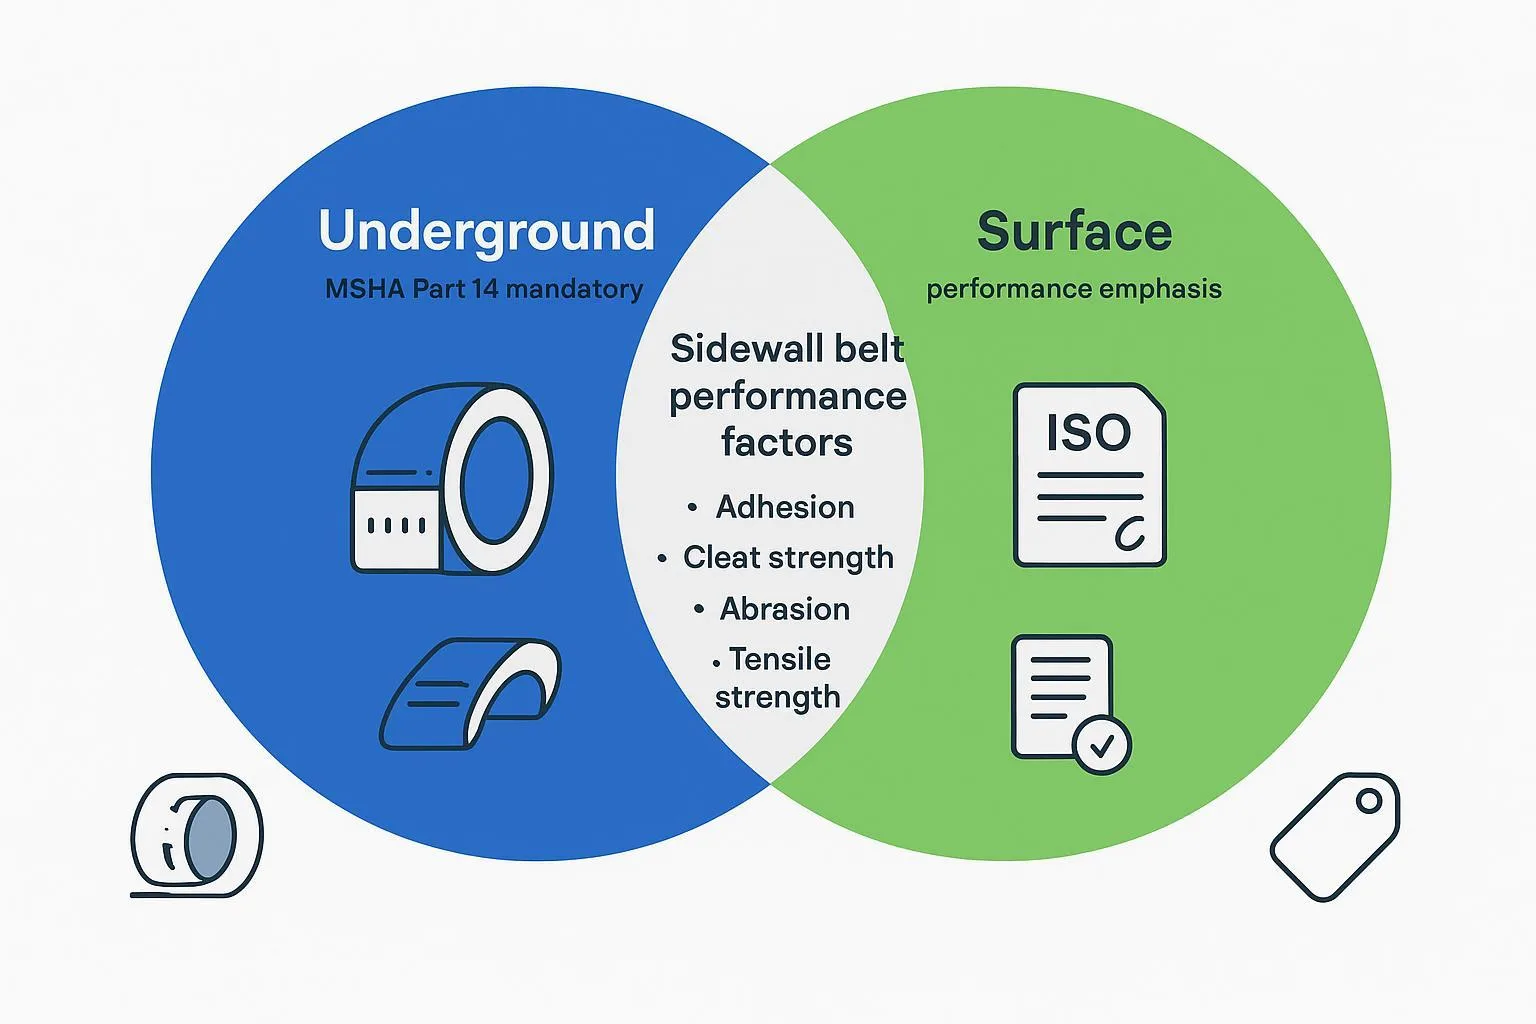
Regional variance: Large open pits in APAC and LATAM are often early adopters; however, spillage and housekeeping concerns are universal across surface and underground operations.
-
Operational implication (conveying): Target OPEX reductions via cleaner blade selection/maintenance, idler alignment and sealing, and traction management at pulleys—lower stoppages and energy per tonne.
Disclosure: BisonConvey is our product. The company manufactures conveyor belts (steel cord, EP/NN fabrics), idlers, pulleys, and cleaners engineered for demanding conditions and long service life. Mentioned here purely as a practical reference when discussing reliability-focused OPEX levers.
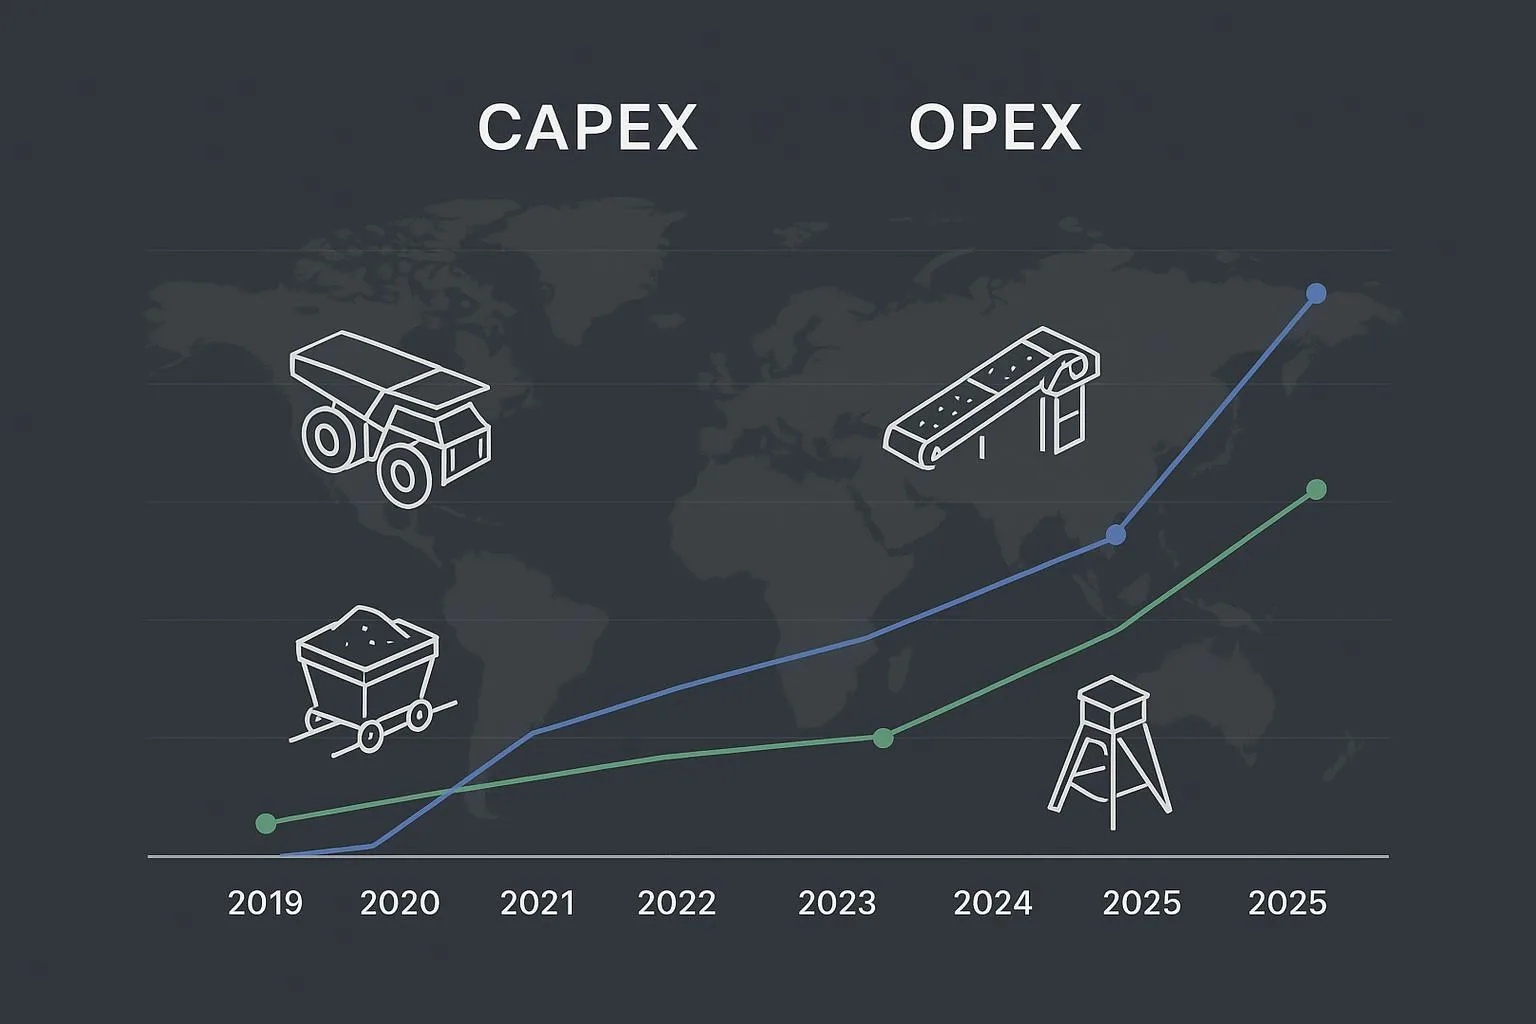
Regional CAPEX signals at a glance (2019–2025 context with 2025 spotlight)
Planning guidance for 2025 budgets
Commodity and inflation tailwinds offer breathing room, but volatility and permitting timelines can quickly change planning assumptions. Focus 2025 spend on reliability levers that reduce cost per tonne and protect OEE: extend belt life with appropriate cover compounds and splicing quality; use sealed, well-aligned idlers to cut energy and mistracking; maintain lagging to prevent slippage; and keep cleaners tuned to curb carryback and housekeeping risk. Freight normalization helps, yet parts strategies should still assume occasional shipping shocks. One question to consider: where will a 2–3% improvement in MTBF most quickly relieve your site’s bottlenecks?
If you need to reference any source details during leadership reviews, use the canonical pages cited above: PwC Mine 2025 for capital discipline and margins; World Bank and IMF for 2025 cost context; NRCan, ABS, and Cochilco for regional investment signals; Drewry for logistics cost baselines; Caterpillar for autonomy signals; and Martin Engineering/ABB for practical conveying OPEX levers.