A few years back, I walked a packaging hall that ran three shifts and still bled overtime. Pallets snaked across the floor on hand trucks, operators waited on each other, and every minor jam triggered a pileup of idle labor. Ninety days later—after a focused conveyor automation pilot—the same hall shipped 22% more volume with fewer hours per case and almost zero overtime. That kind of result isn’t magic. It’s the predictable outcome of removing non-value-added transport and stabilizing flow.
This article shows exactly how conveyor automation reduces labor costs, what benchmarks are realistic in 2024–2025, and how to implement in phases so your ROI holds up under scrutiny.
Where the savings actually come from
Conveyors cut labor costs by attacking the silent time sinks in material flow. Think of manual transport as a tax on throughput—every lift, carry, and wait adds up. Automated belt and roller systems replace that motion with continuous, predictable flow and synchronize handoffs with upstream and downstream equipment.
Here’s the deal: savings show up when you (1) remove manual touches, (2) decouple people from surges with accumulation and buffering, and (3) eliminate wait time through PLC/WMS coordination. In sortation zones, automated diverts move cartons to the right lane without a human. On production lines, accumulation conveyors keep fillers, wrappers, and palletizers running while operators focus on value-added tasks like quality checks or changeovers.
Well-scoped projects commonly hit double-digit labor reductions. Directionally, high-throughput sortation deployments report around one-third fewer direct labor hours in those zones, while mixed manufacturing lines see fewer operators per line and less overtime when transport and accumulation are automated and synchronized.
What the evidence says: benchmarks you can plan around
- According to the MHI and Deloitte collaboration, case examples in the MHI Annual Industry Report 2024 show adopters meeting or exceeding ROI targets; one warehouse program cut reliance on forklift labor by roughly 30% with multi‑year savings in the millions (2024).
- In retail and e‑commerce sortation, vendor-documented results summarized by OPEX show 33–45% labor reductions with near‑perfect sorting accuracy in mature conveyor-based systems (2025). Treat these as directional and validate locally.
- The U.S. Bureau of Labor Statistics reports 2023 total recordable case (TRC) rates of 2.8 per 100 FTE in manufacturing and 4.5 in transportation/warehousing; reducing manual material handling exposure via conveyors aligns with lower injury risk, less lost time, and therefore less overtime backfill, per BLS 2023 SOII.
- McKinsey cautions in late 2023 that misaligned automation (the wrong tech for the SKU mix or order types) leads to underutilization and weak ROI; fit‑for‑purpose scoping is critical, as outlined in Getting warehouse automation right.
Two planning guardrails I use with clients: treat 30–45% direct labor reduction as a high-throughput sortation range when WMS integration and volumes are in place; assume 18–24 months payback in fit‑scoped, well‑utilized deployments. Stress-test those assumptions for your volumes and labor rates.
| Area | Directional labor impact | Conditions for achieving it |
|---|---|---|
| Sortation zones (fulfillment/parcel) | ~30–45% fewer direct labor hours in-zone | Sufficient volume, stable SKU profiles, WMS/WES integration, trained ops |
| Manufacturing/packaging lines | 20–40% efficiency gains; operator reductions of 30–60% on targeted lines | Transport/accumulation automated; synchronized with upstream/downstream equipment |
| Safety-related labor stability | Fewer lost-time incidents and overtime backfill | Guarding and LOTO per standards; reduced MMH exposure |
Implementation roadmap that preserves ROI
Big-bang automation is tempting—and risky. A phased, standards-led rollout protects your payback.
- Phase 1 — Baseline and design
- Run a time-and-motion study: quantify labor hours per unit/ton/order by task; map wait time, rework, and jam recovery time. Capture overtime and temp labor spend.
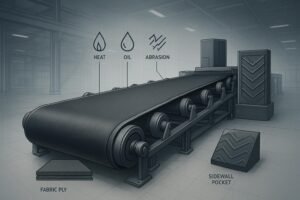
- Choose conveyor types that match the physics: belt vs. roller; straight vs. incline (chevron/sidewall); accumulation for decoupling; specify idlers/pulleys engineered for low rolling resistance and long service life to cut maintenance hours.
- Design for safety from day one: guarding, e-stops, access, and isolation aligned to ASME B20.1, OSHA 1910, ANSI/ASSP Z244.1, and ISO 13849‑1 performance levels.
- Phase 2 — Pilot and integration
- Start with a contained stream (e.g., outbound sortation or one packaging line). Instrument with PLC/HMI and capture run/stop/jam states; integrate with WMS/WES and define exception handling.
- Train operators and maintenance with clear SOPs and LOTO. Document changeover procedures and first-response jam clearing to minimize manual interventions.
- Phase 3 — Scale and optimize
- Expand to adjacent flows. Introduce accumulation zones and automated merges/diverts to smooth surges and protect labor from variability.
- Use CI loops: track jam root causes, belt tracking, idler alignment, and MTBF/MTTR. Lock in gains by monitoring labor hours per unit, overtime, and temp reliance.
Quick implementation checklist
- Validate the problem with measured hours by task and overtime history.
- Pick the right conveyor types and components for your duty cycles and product mix.
- Engineer safety and functional safety at the concept stage, not after install.
- Pilot a single stream; instrument it; agree on success metrics before go‑live.
- Train to standard work; audit adherence; refine based on real data.
- Scale only after the pilot hits target labor deltas and uptime.
Sector snapshots: where savings show up fastest
- E‑commerce and parcel: Automated sortation is the lead candidate for direct labor reduction. When volumes justify the capex and WMS orchestration is mature, it’s common to see roughly one‑third fewer in‑zone labor hours along with accuracy gains that prevent rework.
- Manufacturing/packaging: Line conveyors and accumulation reduce operator counts and overtime by eliminating manual pallet/case transport between machines. The savings are most defensible when the line is balanced and changeovers are scripted.
- Mining, ports, cement/steel: Continuous conveyors already dominate long-distance transport, so the labor story leans toward maintenance efficiency—reduced interventions from better components, improved guarding and access, and smarter instrumentation. Publishable, audited before/after labor-hour deltas are rarer in public sources; if you have local data, use it to tune your business case.
ROI/TCO modeling: build a case finance will sign
You’ll want a complete picture: direct labor cuts, overtime and temp labor reductions, injury-related savings, and secondary effects like throughput and error reduction. Sensitivity-test the model against volume variability and utilization.
Core inputs to include
- Pre‑automation labor hours by task, wages/benefits, overtime premiums, temp labor spend
- Baseline throughput and order/SKU profiles; error/rework rates
- Incident costs (lost time, claims) and expected reductions from safer design
- Capex, depreciation, IT/integration, commissioning and training costs
- Maintenance and energy baselines; expected changes from low rolling resistance belts, UHMWPE or ceramic‑lagged components, and improved alignment
Example workflow: using an ROI calculator to validate labor savings
Disclosure: BisonConvey is our product.
Let’s say your outbound sortation team staffs 12 FTE across two shifts, with 20% overtime during peaks. After a pilot, you measure a 35% reduction in in‑zone labor hours and a 70% drop in overtime. Plug the pre‑ and post‑pilot hours, wage rates, and capex into the Conveyor ROI Calculator. Then run three utilization cases (base, –10%, +10%). In most high‑throughput sites that hit the 30–45% labor delta, the model shows payback landing in the 18–24 month range. Finance cares about variance—so include your sensitivity cases in the appendix.
Safety and compliance as labor cost relief
Compliance isn’t just about audits; it stabilizes labor by preventing incidents and unplanned downtime. The ASME B20.1‑2024 Safety Standard for Conveyors and Related Equipment sets design and guarding expectations across conveyor types. An overview of the current edition is summarized by ANSI in ASME B20.1‑2024 Safety Standard for Conveyors. Layer OSHA 29 CFR 1910 machine guarding and ANSI/ASSP Z244.1 control of hazardous energy (LOTO), and you create a safer, repeatable operating envelope. Add ISO 13849‑1 performance levels for safety-related control functions, and your e‑stops, interlocks, and safety sensors behave predictably.
What’s the labor connection? Fewer recordables mean fewer lost-time incidents and less overtime backfill. Better access and guarding reduce micro‑stoppages and the need for skilled responders to intervene. When you standardize LOTO and first‑response jam clearing, you shorten mean time to respond and keep people on productive work.
Next steps
- Map your current-state labor with a one-week time-and-motion study, then pilot a contained conveyor stream. For integration tips, start with Best Practices for Conveyor Integration.
- When you have pilot data, build the business case and sensitivity checks. Use the Implementation Checklist & How-To Videos to structure rollout and training.
Author: Senior Industrial Automation Consultant, BisonConvey — 7+ years optimizing conveyor and robotics projects across manufacturing, logistics, and heavy industry.